The Task Manager is a powerful Windows 11 utility that provides detailed real-time information about the software and hardware on your PC. It’s also indispensable when troubleshooting applications, monitoring hardware resource usage, and managing startup programs.
In this in-depth guide and overview, you’ll learn everything you need to know about the Task Manager in Windows 11, including ways to use it effectively.
Opening the Windows 11 Task Manager
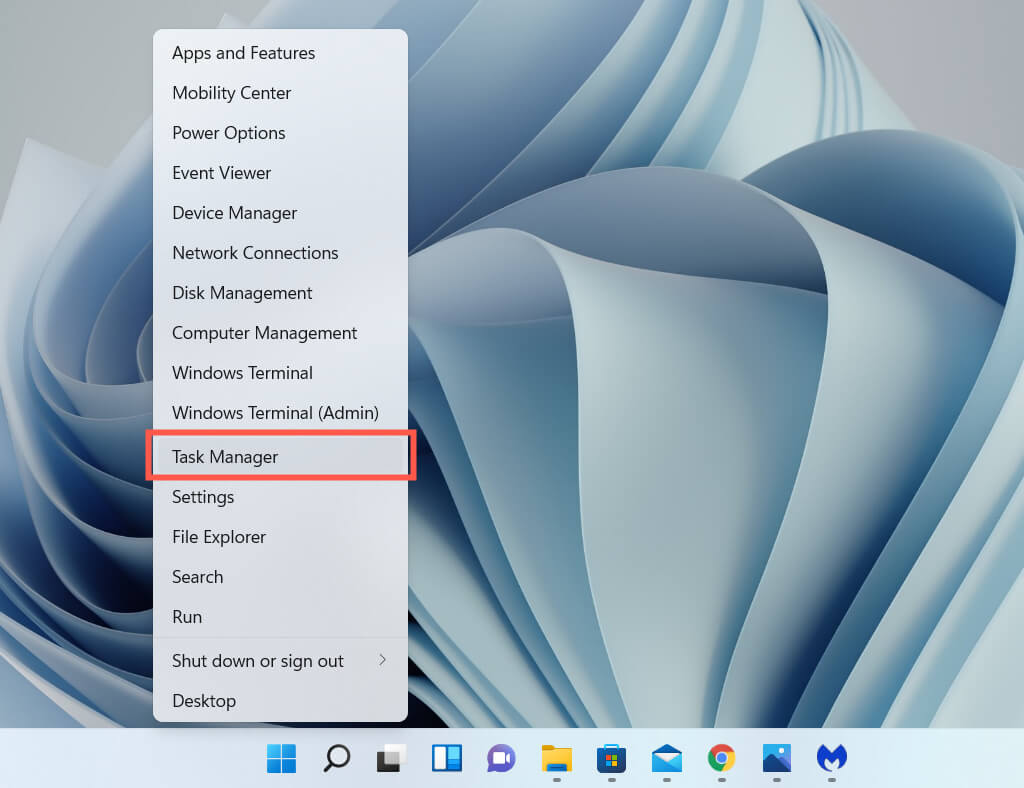
In Windows 11, you can launch the Task Manager just like any other program by selecting Start > All Apps > **Windows Tools **> Task Manager. However, the most convenient way to invoke it is through the Power User menu (right-click the Start button and select Task Manager).
If you prefer keyboard shortcuts, pressing Ctrl + Shift + Esc will quickly bring up the Task Manager. If the operating system appears stuck, you can still get to it by pressing Ctrl + Alt + Delete (which opens Windows 11’s Security Screen) and then selecting Task Manager.
The Default Task Manager
The Windows 11 Task Manager appears as a stripped-down version of the full user interface by default. It’s tiny, features no menu options, and simply shows a list of active apps on your computer.
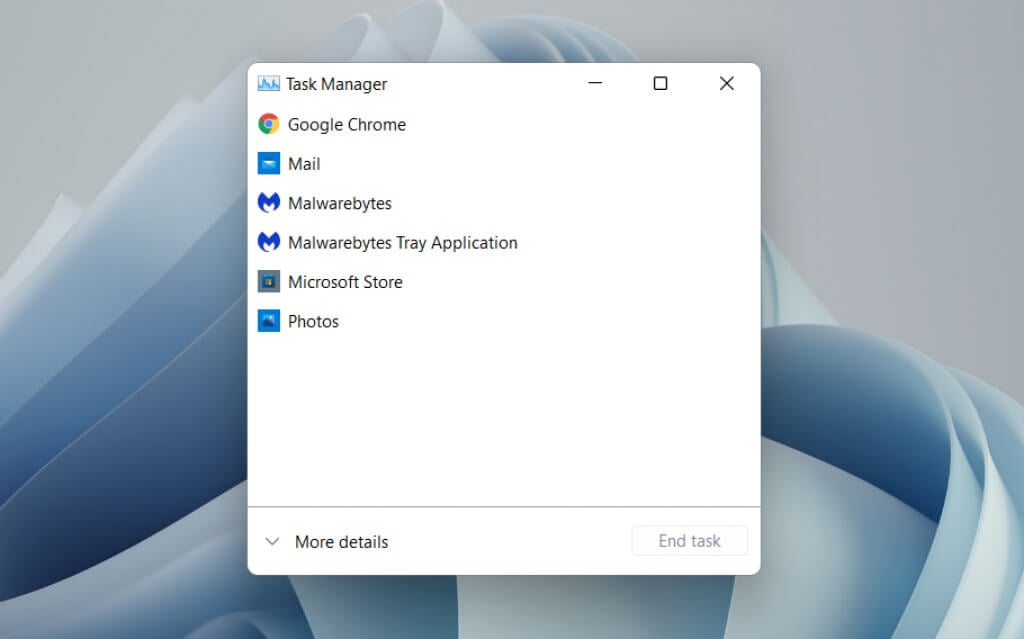
You can choose any app within the list and forcibly shut it down by selecting the End task button. That’s the quickest way to quit unresponsive programs.
Right-clicking any app within the list also reveals multiple contextual options as follows:
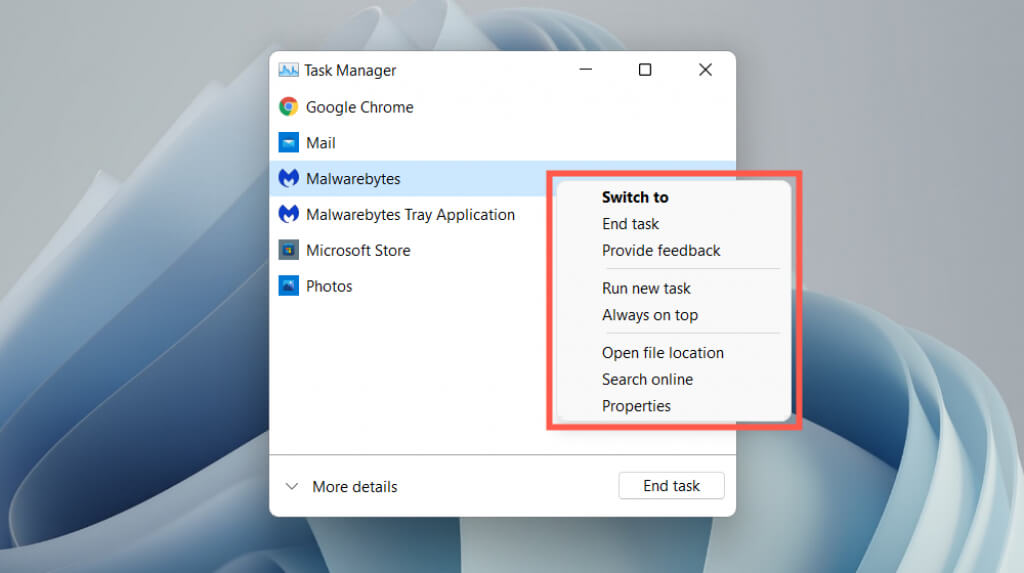
- Switch to: Immediately brings the app into focus.
- **End task: **Forcibly shuts down the app. It’s the same as selecting the End task button.
- **Provide feedback: **Provide feedback to Microsoft.
- Create dump file: Generate a dump (.DMP) file of the program, which is often requested by support engineers for troubleshooting purposes. You can also analyze dump files yourself.
- Run new task: Launch a new program, folder, or document with or without elevated privileges in Windows.
- Always on top: Place the Task Manager on top of other apps. This option also works in expanded view, which then helps you track resource usage in real-time.
- Go to details: Automatically select the executable file related to the program within the Details tab in the expanded view.
- **Open file location: **Opens the directory of the program’s main executable file in a File Explorer window.
- **Search online: **Perform an online search using Bing. If you don’t recognize a program, use this option to learn more about it.
- **Properties: **Brings up the program executable’s Properties dialog box. You can then check or modify its general, compatibility, and security settings and view additional details such as the version, publisher, etc.
The Expanded Task Manager
Select the More details button at the bottom left corner to expand the Task Manager’s user interface. You can always select Fewer details to go back to the stripped-down version whenever you want.
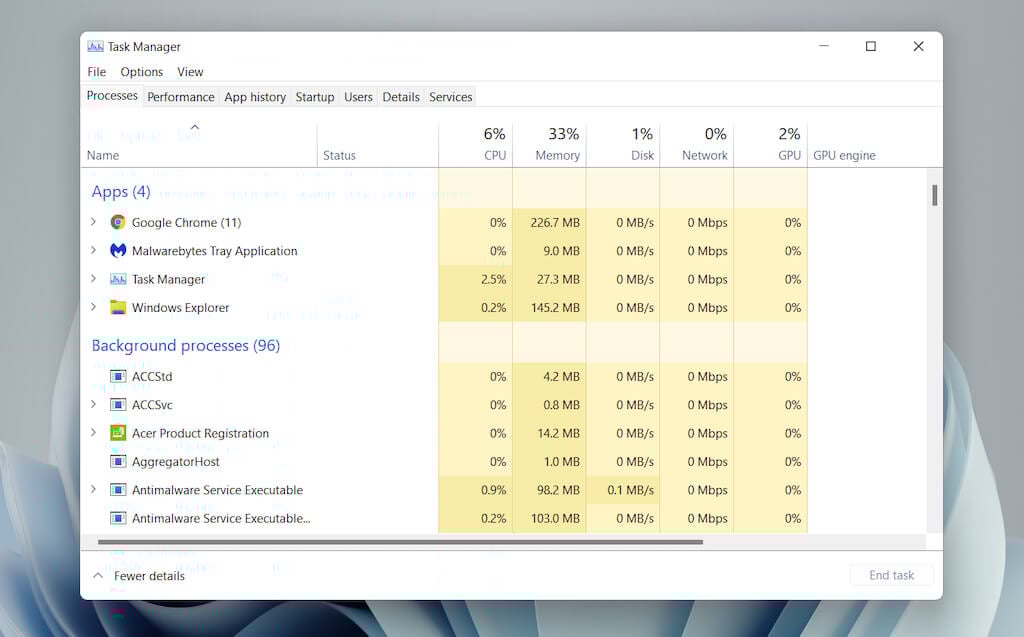
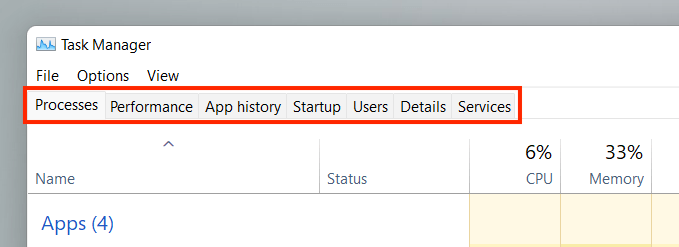
The expanded Task Manager consists of multiple tabs—**Processes **(default), Performance, App History, Startup, Users, Details, and Services. You can change the default tab that appears when you open Task Manager by selecting Options > Set default tab on the menu bar.
Task Manager – Tab Overview
You’ll go through each tab in more detail below, but here’s a brief overview:
******Task Manager – Menu Options**
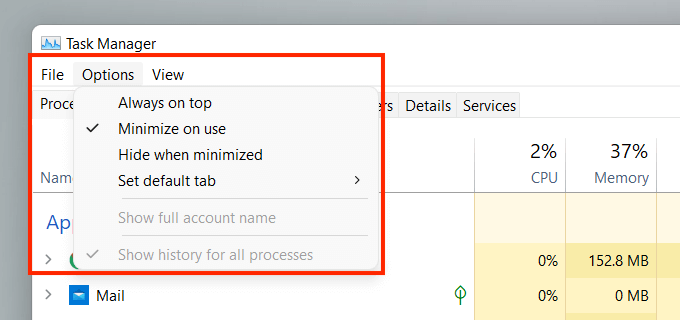
In the expanded view, you’ll find a list of menu options to the top of the Task Manager—**File**, **Options**, and **View**.
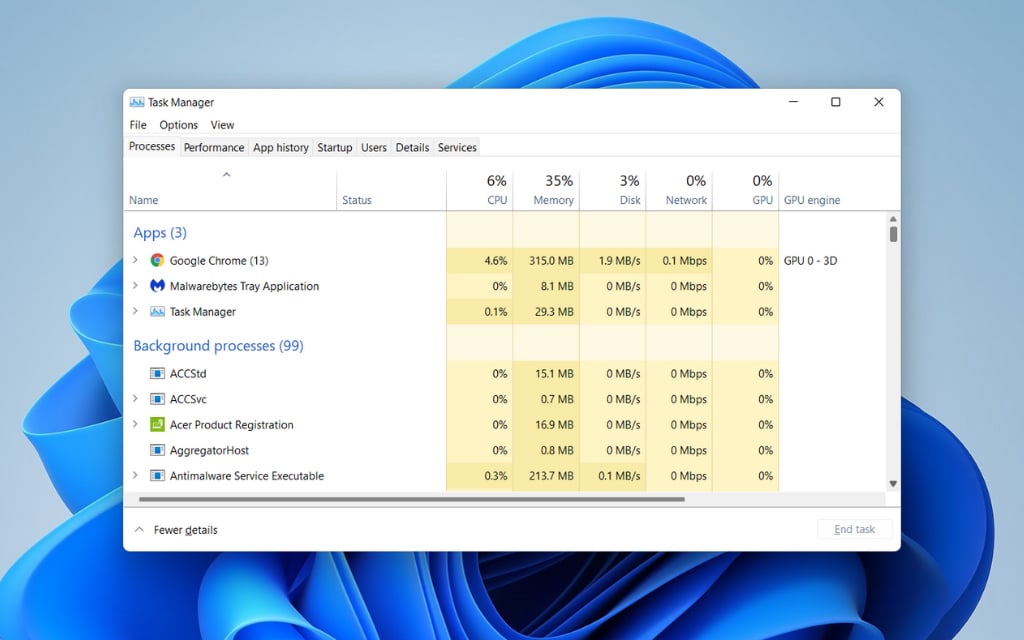
The Processes Tab
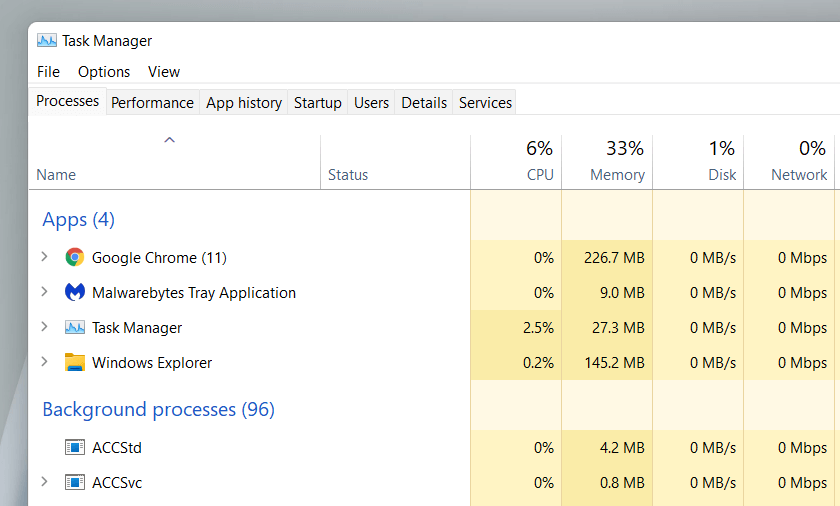
The Processes tab in the Windows 11 Task Manager features a list of live processes on your PC, along with real-time usage stats under separate columns.
**Processes Tab – Name Column**
The Apps section at the top of the Name column sports a list of all open programs in Windows 11. The Background processes section features apps that run in the background (e.g., the system tray). A third section—labeled Windows processes—lists processes related to the operating system.
If you want, you can merge the sections list by unchecking View > Group by type on the Task Manager menu. However, that makes it harder to locate specific apps and processes.
By default, the Task Manager groups and hides the sub-processes related to each program. To reveal them, simply double-click a program’s name or select the tiny arrow icon next to it.
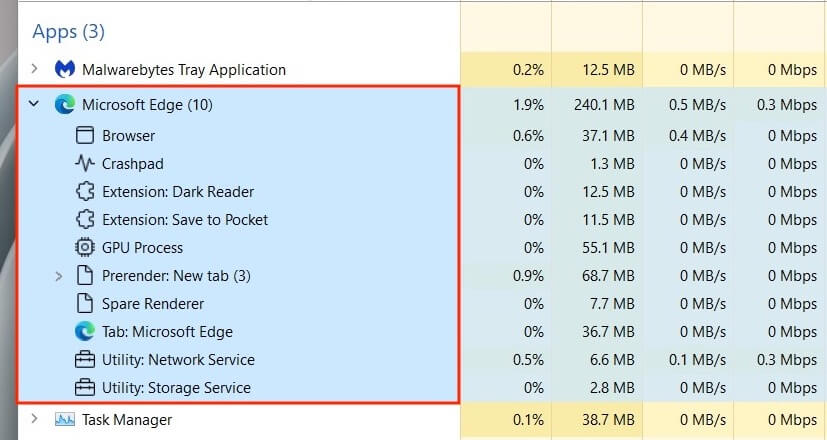
Optionally, use the View > Expand all and Collapse all menu options to expand and collapse all sub-processes under the Processes tab.
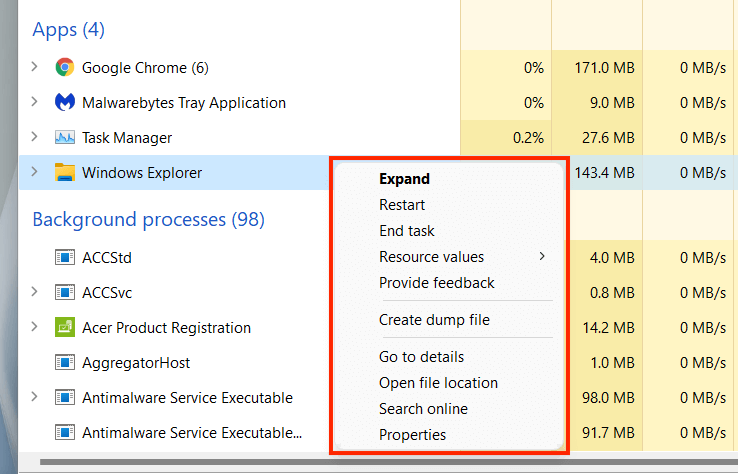
Right-clicking a process reveals multiple options, similar to what you get in the Task Manager’s simplified view. An exception is the integral Windows Explorer process, which features a Restart option instead of End task. That allows you to troubleshoot File Explorer-related issues by restarting it.
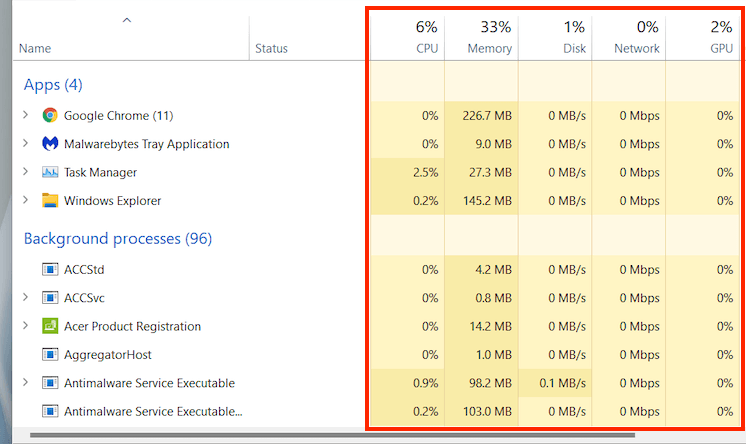
**Processes Tab – Other Columns**
The Processes tab contains additional columns that provide real-time system resource usage stats and insights for each process and subprocess, along with colors that shift between yellow and red to indicate minor to heavy resource usage.
The CPU, Memory, and Disk columns are arguably the most important since they let you spot programs that consume lots of resources. Selecting a column enables you to sort processes from the most resource-intensive to the least and vice-versa. This can be useful, for example, in figuring out things like which apps are causing the most CPU or Disk activity.
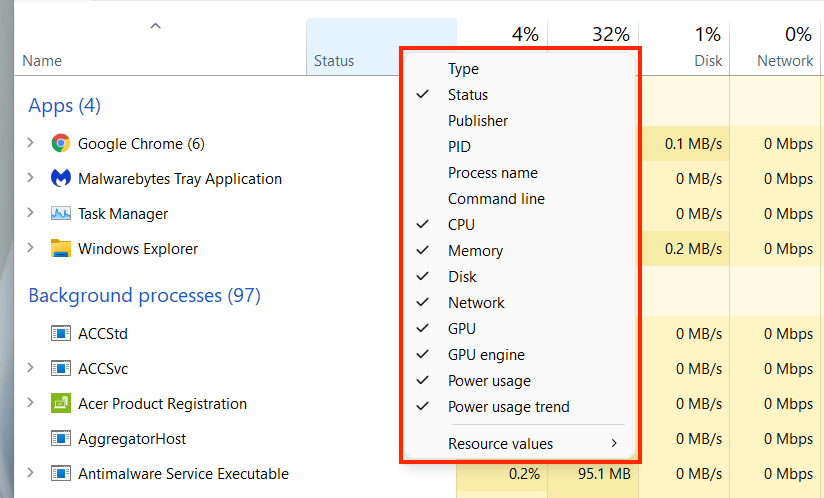
**Processes Tab – Additional Columns**
Right-clicking any column also gives you the option to activate additional columns:
The Performance Tab
The Performance tab in the Task Manager lets you monitor total real-time utilization of the CPU, memory, disk, network, and GPU in Windows 11. Select each hardware component on the sidebar to view the relevant information.
**Performance Tab – CPU**
Displays CPU utilization by all processes over 60 seconds on a scale of 0-100. On multi-core CPUs, right-click the graph and select Change graph to > **Logical processors **to display separate charts for each logical processor. Hovering your cursor over a processor will reveal if the operating system has “parked” it to conserve power.
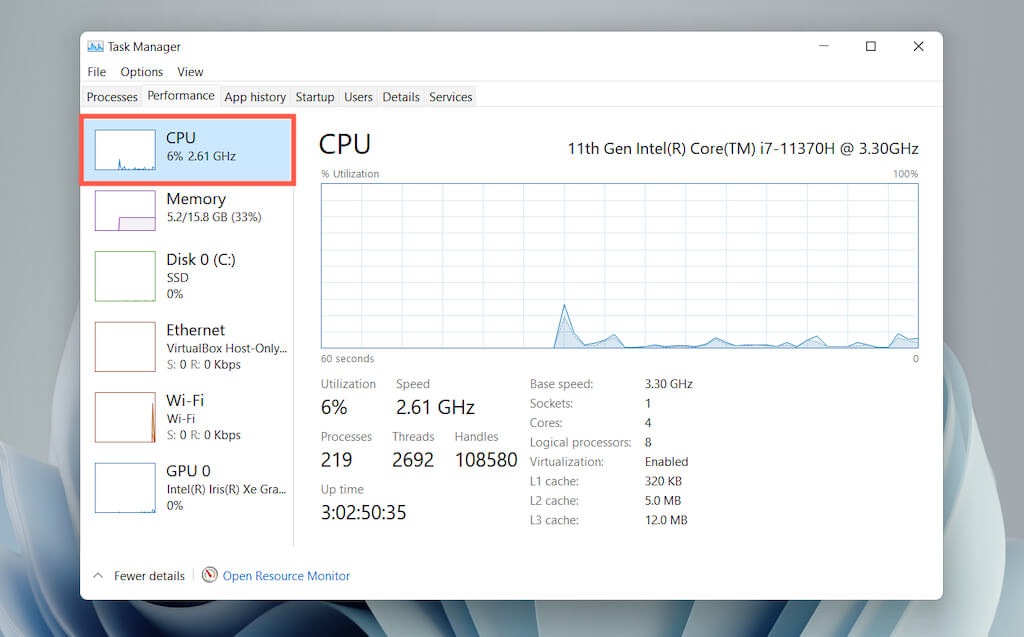
Underneath the graph, you’ll find the following information:
- Speed: Current speed of the CPU.
- Processes: Total number of processes handled by the CPU.
- Threads: Thread count for all processes handled by the CPU.
- Handles: Total number of associations with shared resources (files, programs, memory locations, etc.).
- Up****time: Time since you last turned on your PC.
The rest consists of general information related to the CPU, such as the processor model, base speed, and virtualization status.
Performance Tab – Memory
Displays total RAM usage in graphical format over 60 seconds on a scale of 0-100. In addition, a separate graph labeled Memory composition reveals a snapshot of the memory consisting of the following in different shades of color:
- Modified: Memory that must be written to the disk before it can be repurposed.
- Standy: Memory consisting of cached data not in active use.
- Free: Memory that’s immediately available for use.
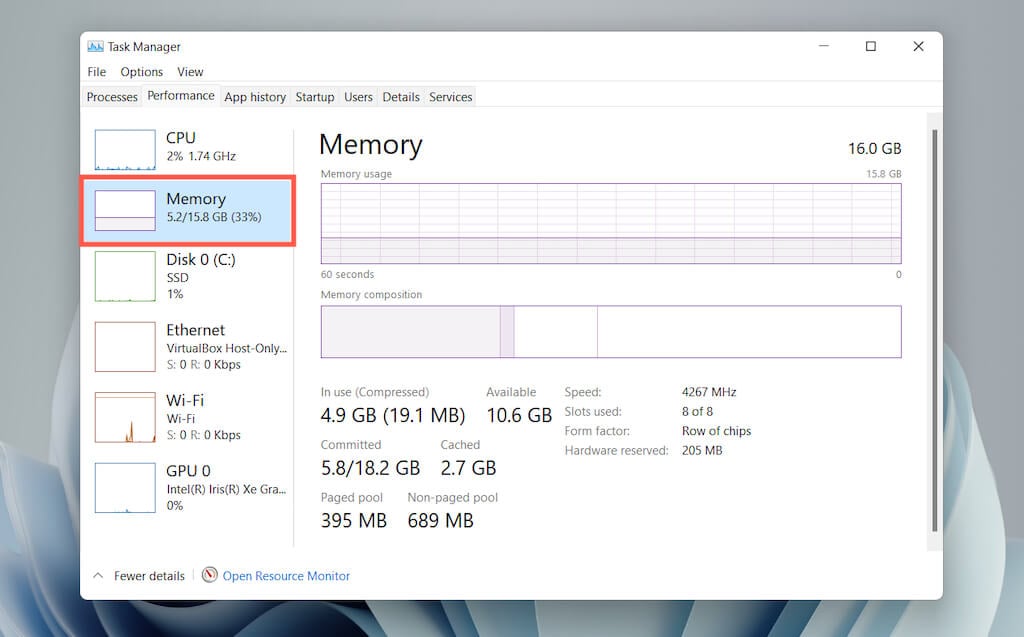
Underneath both graphs, you’ll see the following information as numeric values:
The rest is general information about the physical memory modules—speed, the number of RAM slots used, and the form factor.
**Performance Tab – Disk**
Depending on the number of partitions and removable drives on your PC, you may see multiple disks listed under the sidebar. Each consists of two graphs that display disk utilization over 60 seconds on a scale of 0-100.
The Active time graph reveals the read and write requests, while the Disk transfer rate graph displays transfer rates between the drive and the operating system.
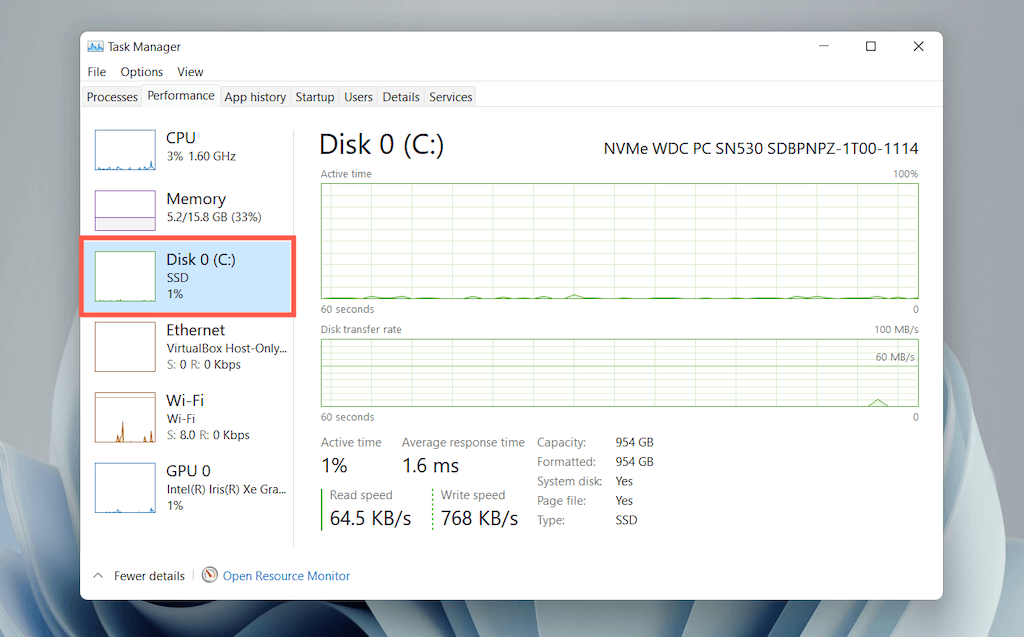
In addition to general drive-related information such as capacity, model, and type (HDD or SSD), you’ll see the following information:
- Average response time: Average amount of time to complete read and write requests.
- Read speed: The disk drive’s current read speed in kilobytes per second.
- Write speed: Current write speed of the disk drive in kilobytes per second.
Performance Tab – Wi-Fi/Ethernet
Reveals network information such as the adapter name, SSID, connection type, send and receive speeds (in Kbps), IPv4 and IPv6 addresses, and signal strength.
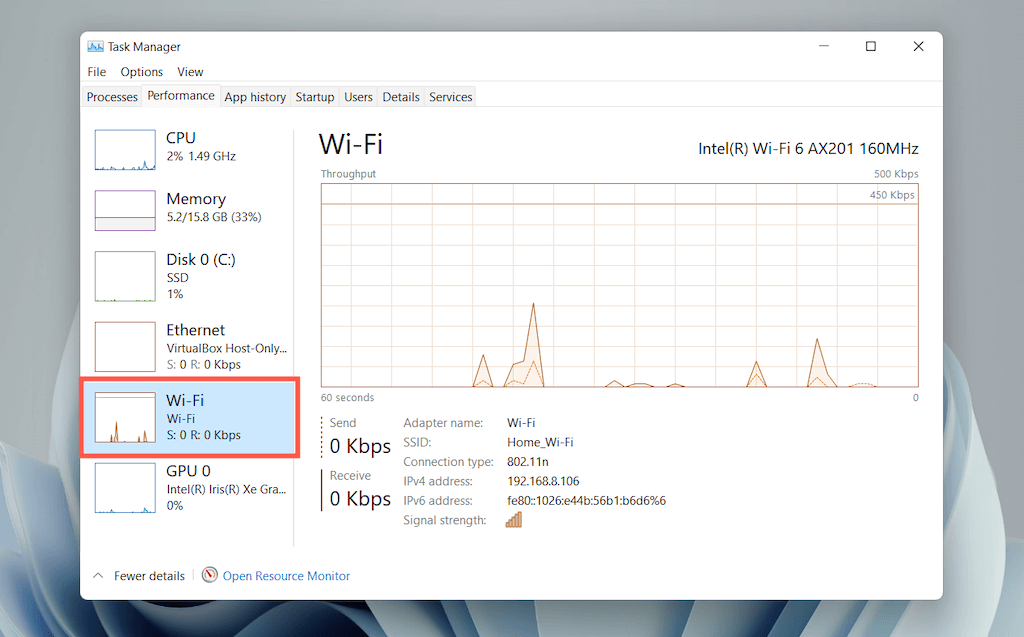
The graph displays total network utilization by apps and the operating system. Right-clicking the chart and selecting View network details will reveal extra information regarding network activity.
Performance Tab – GPU
Displays the GPU model, utilization, and other information regarding your PC’s video card, such as the amount of dedicated or shared memory and driver version. However, this section may not show up on computers with integrated graphics.
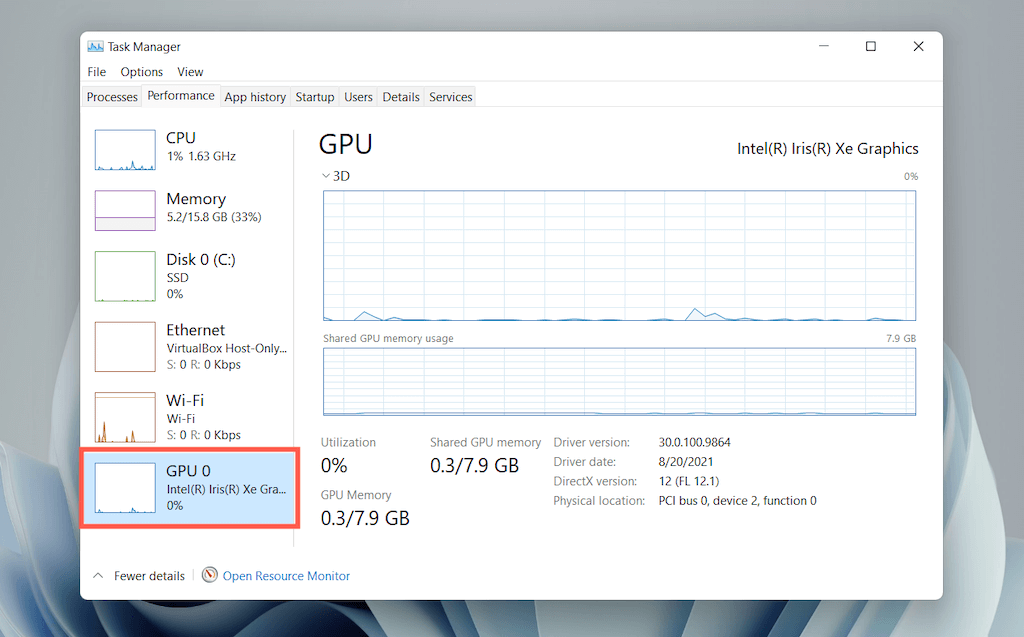
You can switch the default graph to display activity by GPU engine (3D, Video Decoding, Video Processing, etc.) by right-clicking and selecting **Change graph to **> Multiple engines.
Note: Windows 11 also includes an advanced hardware monitoring utility dubbed the Resource Monitor. Select Open Resource Monitor at the bottom of the Performance tab to get to it.
The App History Tab
The Task Manager’s App History tab displays the total CPU and network usage stats for Microsoft Store apps. If you want, you can include non-Store apps within the list by selecting Options >** Show history for all processes** on the menu bar.
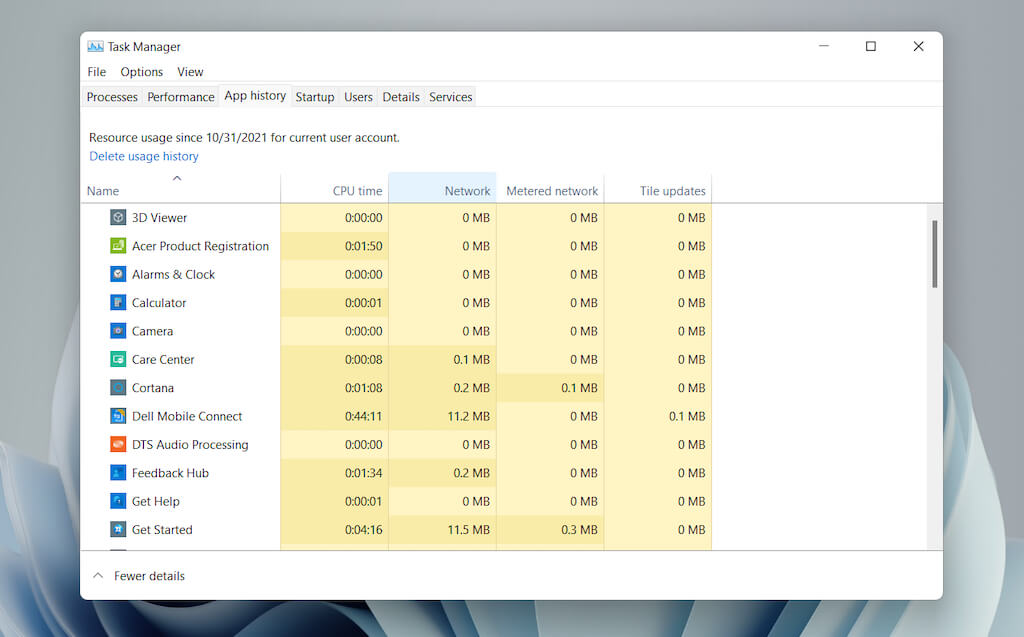
You can reset the count for all columns by selecting Delete usage history at the top of the screen.
App History Tab – Default Columns
The App History tab displays the following columns:
- CPU time: The total time the program has utilized the CPU since the last reset.
- **Network: **The total bandwidth (in megabytes) consumed by the program.
- **Metered network: **The total amount of data the program has consumed on metered networks.
- **Tile updates: **Data consumption related to live tile updates in the Start menu. This option is irrelevant since live tiles aren’t present in Windows 11. However, you may still see activity in the column with older apps that attempt to trigger updates in the background.
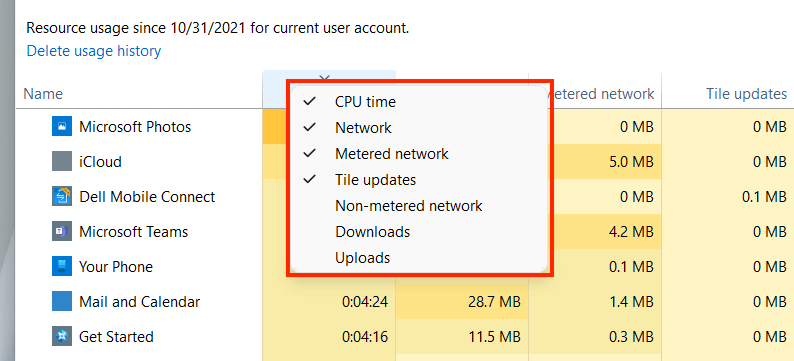
App History Tab – Additional Columns
Optionally, you can right-click any of the existing columns to activate the following columns:
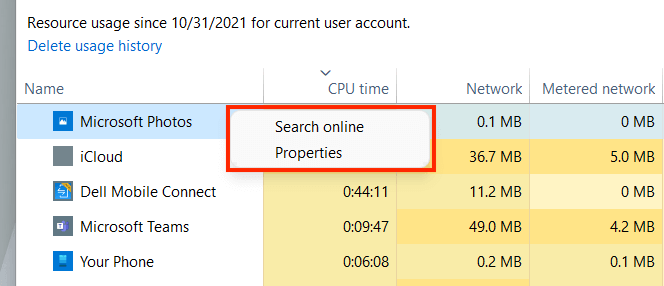
**App History Tab – Contextual Options**
Right-clicking an app reveals the following options:
The Startup Tab
The Startup tab in the Task Manager lists every app that loads at computer startup. Since multiple start programs can adversely impact the operating system’s performance, you can use this tab to manage them.
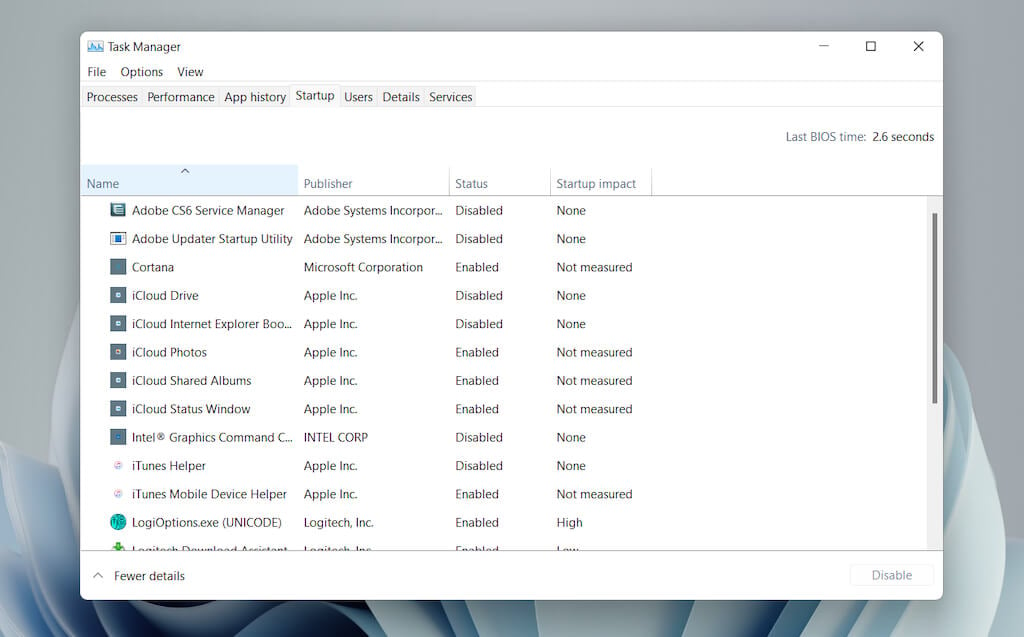
**Startup Tab – Default Columns**
The startup tab lists the following columns:
- **Publisher: **The program’s publisher.
- **Status: **The program’s status (Enabled or Disabled).
- **Startup Impact: **The startup impact of the program (Low, Normal, High, or Very High).
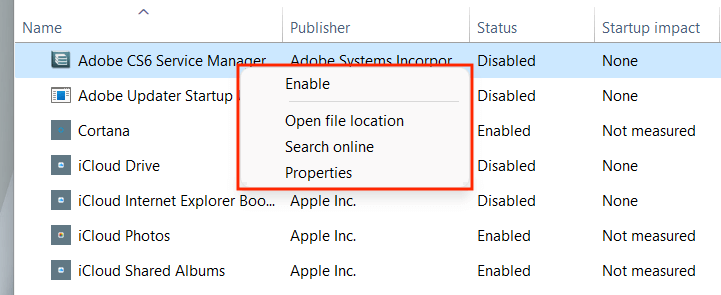
Startup Tab – Contextual Options
Right-clicking an app reveals the following options:
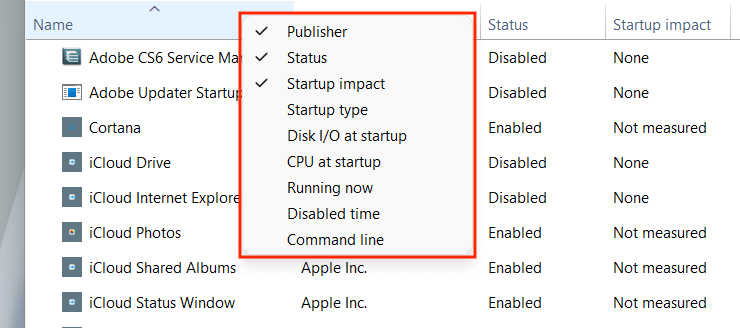
**Startup Tab – Additional Columns**
You can also right-click an existing column to activate any of the following columns:
The Users Tab
The Users tab in the Task Manager displays a list of all users on your computer. It’s similar to the Processes tab, except that you can view resource usage by user.
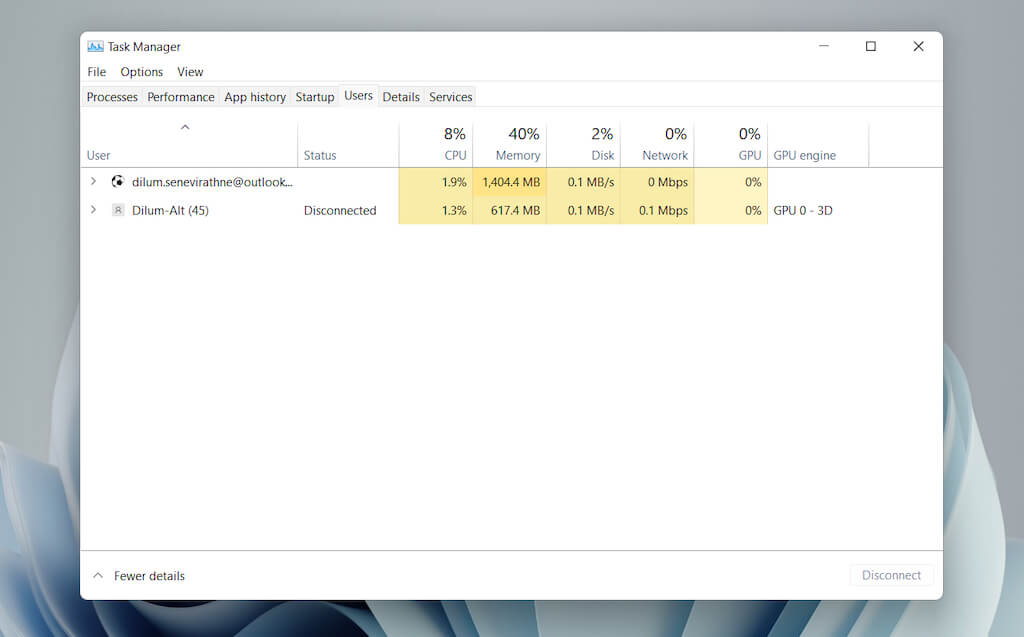
**Users Tab – Default Columns**
You can find the following columns within the tab:
- Status: Displays the status of each process for a user, including if the processes are suspended or not.
The CPU, Memory, Disk, Network, GPU, and GPU engine are essentially the same compared to what you see on the Processes tab.
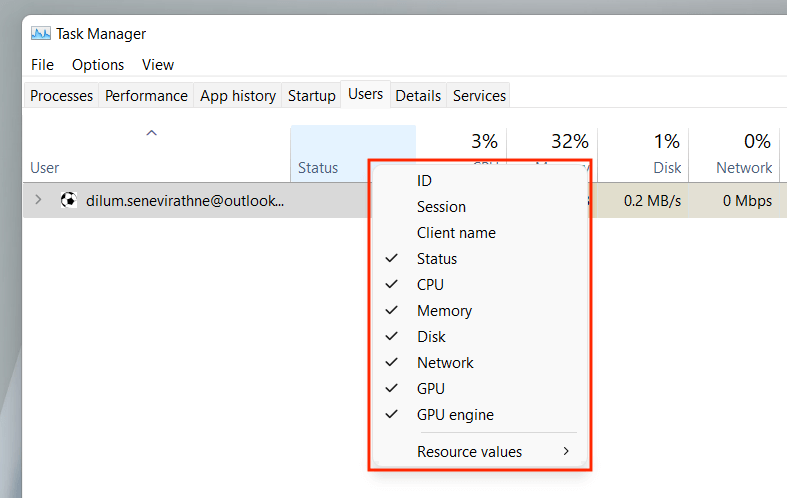
Users Tab – Additional Columns
Right-clicking an existing column allows you to activate additional columns:
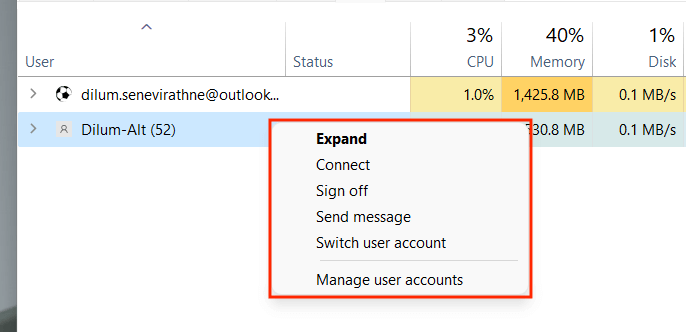
**Users Tab – Contextual Options**
Right-clicking a user reveals the following contextual actions:
The Details Tab
The Details tab offers an expanded view of all processes on your computer, including those from other user accounts. It’s similar to the Processes tab from the Task Manager in Windows 7 and earlier.
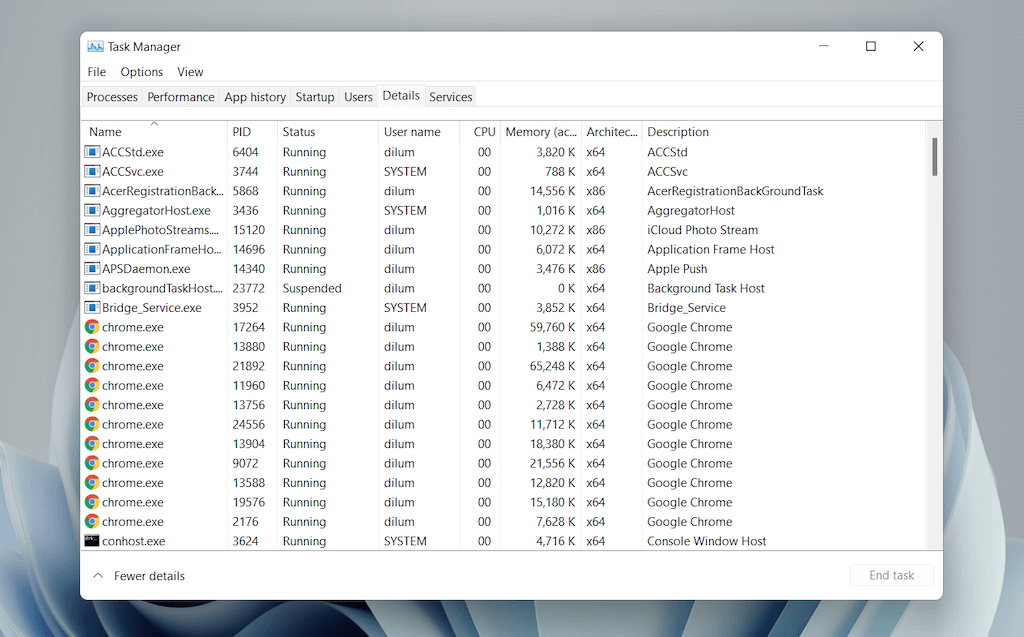
**Details Tab – Default Columns**
The Details tab is broken down into the following columns:
- PID: Unique number assigned to each process.
- Status: Status of the process—Running or Suspended.
- User name: What initiated the process—you, another user, the operating system, etc.
- CPU: CPU activity related to the process.
- Memory: The amount of memory used in kilobytes.
- Architecture: Architecture of the process – 32 or 64-bit.
You can also activate a host of additional columns by right-clicking an existing column and selecting Enable additional columns. However, these are highly technical and best suited for power users, so we won’t go over them here.
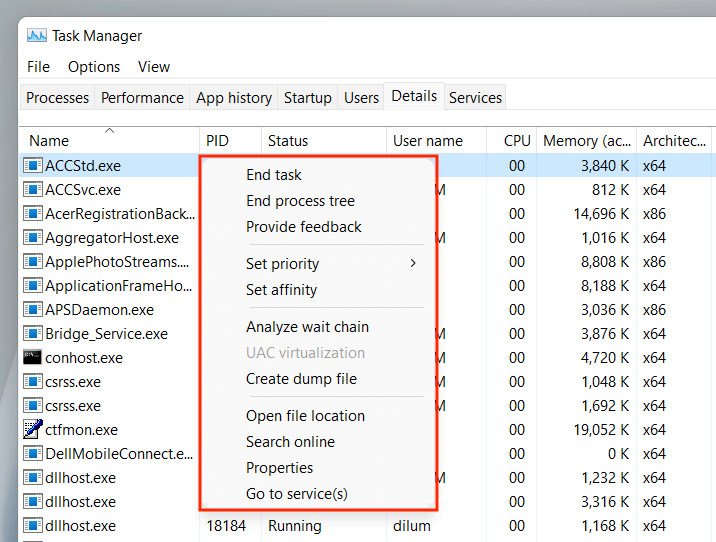
Details Tab – Contextual Options
Right-clicking a process reveals the following options:
The Services Tab
The Services tab details every native and third-party service on your PC, such as those related to Windows Update, Bluetooth, the Print Spooler, etc. It lets you start, stop, and restart services.
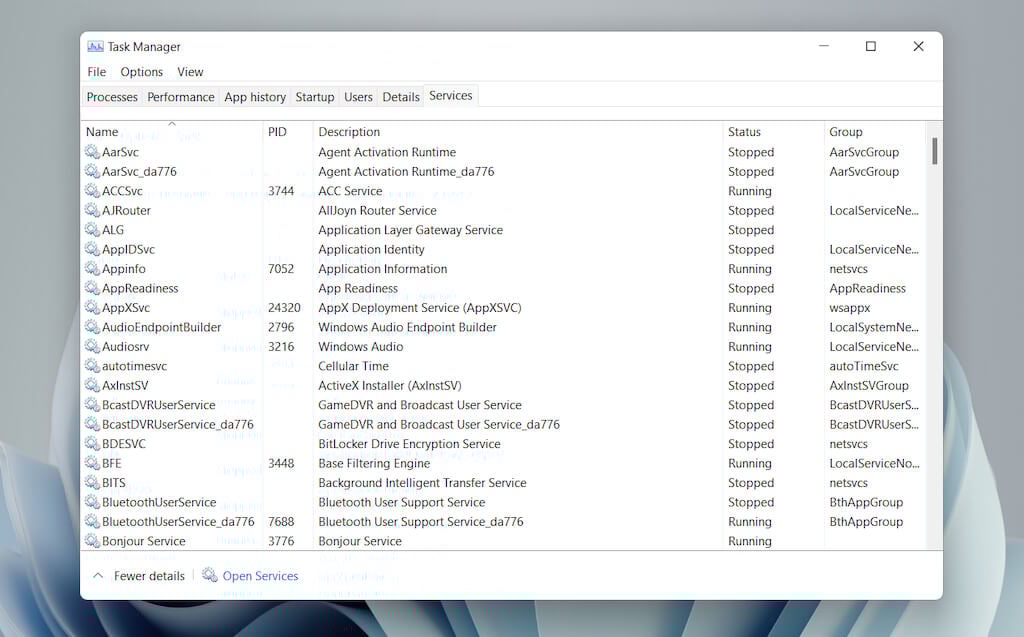
**Services Tab – Default Columns**
The services pane consists of the following columns:
- PID: Process ID of the service (helpful in identifying the service-related process).
- Description: Brief description of each service.
- Status: Status of the process (Running or Stopped). Some processes may show up as Starting if they appear to be stuck.
- Group: Reveals any related group that a service is a part of.
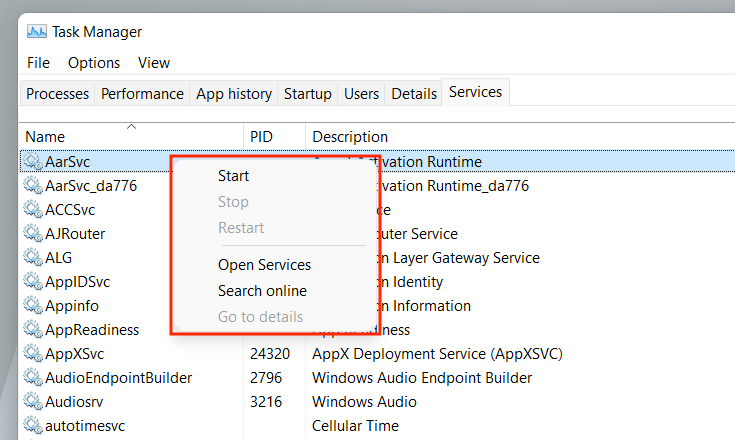
Services Tab – Contextual Options
Right-clicking a service will reveal the following contextual options:
Put the Task Manager to Good Use
The Task Manager in Windows 11 is instrumental in identifying how your PC’s various programs and hardware work. Despite being filled with lots of information and options, however, getting a brief understanding of what it takes to shut down troublesome apps and manage resource-heavy processes alone can positively impact day-to-day usage.